The Recession (Intro)
Remember in The Big Short when everyone told Hedge Fund Manager Michael Burry that he was crazy for shorting the housing market in the mid-2000s? Well…consider this my Michael Burry moment.
The U.S. economy is barreling towards stagflation and a recession due to the irreversible affects from Jerome Powell and the Federal Reserve being far too late to address rising inflation in 2021-22.
During the Fed’s historic tightening cycle to “tame” the same inflation they originally labeled transitory, they raised the Federal Funds Rate from 0.08% in March of 2022 to 5.33% in July of 2023, the last meeting they hiked.
While the rate of inflation has been brought back down (see below), the affect it has on an economy is cumulative, and getting inflation down to the Fed’s goal of 2% has proven to be much more difficult, or at the very least stubborn, than some had hoped. I could go into great detail on why I think inflation is going to be a factor well into 2025, but we’ll save that for another day.
Point being, the Fed is now facing the repercussions for months and months and months of calling inflation “transitory” in 2021. So what does that have to do with a recession? My opinion is that we are yet to see the true lag affects associated with raising rates so fast in such a short period of time. It takes years for higher rates to work through the economy, and I also believe the economy is much weaker underneath the surface than headlines proclaim.
Let’s dive in, starting with…jobs. On Friday, the BLS released the U.S. jobs report for May. Total non-farm payrolls during the month increased by 272K, beating not only the expectation of 180K, but every single Wall St. estimate. That sounds great, right?! More Americans employed! In the words of the great Lee Corso - “Not so fast, my friend!!!”
First off, the unemployment rate rose to 4.0%, after remaining under 4% since February of 2022. Also, the headline number doesn’t tell the story of the U.S. employment situation like you think it would.
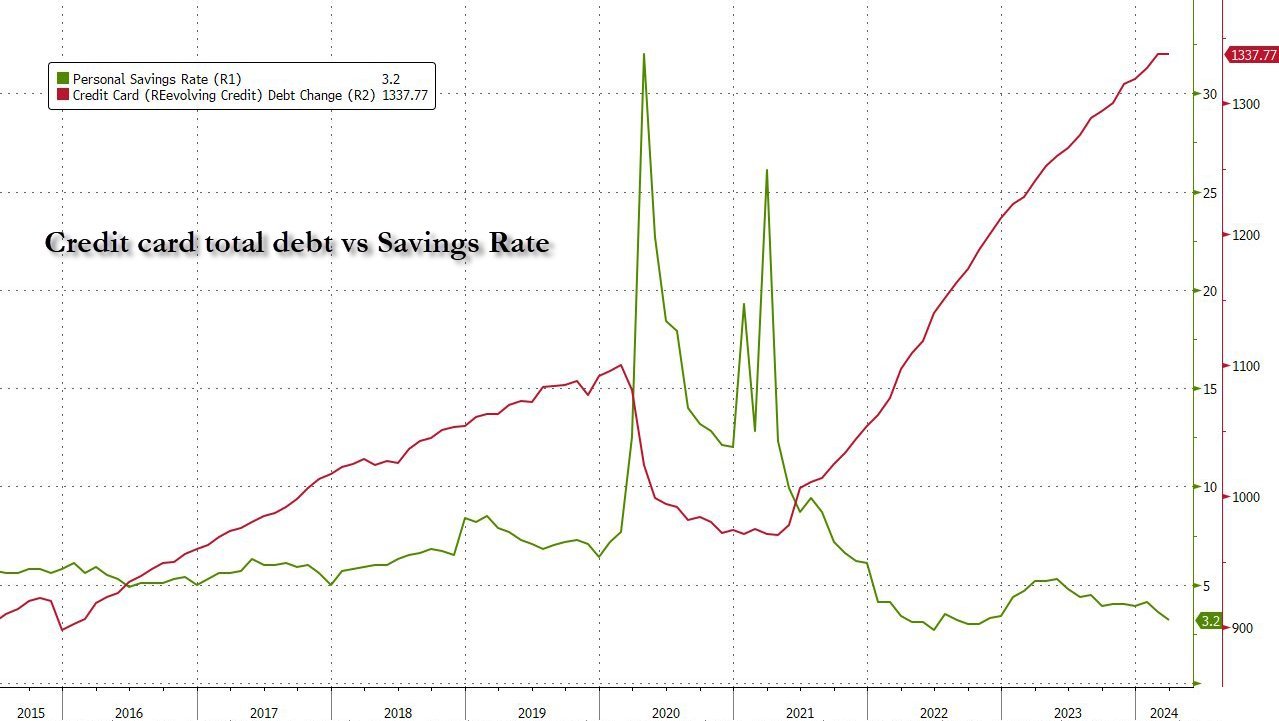
The Household Survey, which accompanies the NFP report, noted a loss of 408K jobs, with full-time jobs falling by 625K in May, while part-time jobs were up 286K. In fact, according to the Household Survey, the number of full-time jobs lost over the last year now sits at 1.2 million. That is not a strong labor market. Part-time jobs in the leisure, hospitality, and health services are saving the day. And sure, those jobs are important, but they are temporary. What happens when people run out of savings and can’t afford to go to go on vacation anymore? Those part-time hotel workers that are still being hired…get fired. That’s when sh*t really hits the fan. Oh…by the way, the savings rate is the lowest it has been in a decade, while credit card debt continues its post-COVID surge:
Source: Zerohedge
Now that my rant on a much weaker than meets the eye job market is over, let’s shift back to the Fed for a minute. Part of the reason the S&P 500 is up nearly 13% year-to-date is because the market was expecting 6 rate cuts (yes…six lol) by the Fed in 2024. Well, the June FOMC meeting is this Wednesday, and I guarantee you they are not cutting. If we take a look at the CME FedWatch Tool below, not only are we not getting a cut this week, odds are now favoring no cut in September either, the month in which many Wall St. firms have been (and still are) projecting the first cut. As of Sunday, June 9th, there is a 51% chance the Fed Funds rate stays the same on September 18th, 2024. One month ago, there was only a 31% chance of no cut.
Source: CME FedWatch Tool
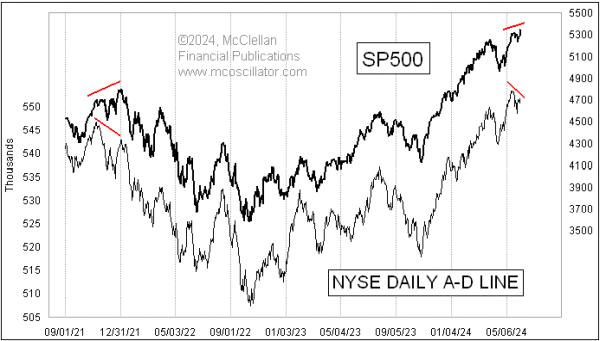
The market loved rallying on the idea of rate cuts, even though you historically don’t want to be long the market when the Fed starts cutting. Nonetheless, this hope, plus euphoric and irrational exuberance over Artificial Intelligence has fueled the market to record highs in 2024. But not every stock is rallying like its 1999, like Nvidia is. In fact, market breadth is quite weak.
Below is a chart from Tom McClellan showing that we have a bearish divergence in the S&P 500’s Advance-Decline line. The Advance-Decline line is a technical indicator charting the difference between advancing and declining stocks on a daily basis. Basically, the chart below is telling you that big weightings in the index (like Nvidia) are driving the market to its record-high, but the rest of the market is not partaking. This is what is called weakening or bad “breadth.” While the S&P has been going up recently to new, breadth has been declining. This is a major red flag for me, and makes me very cautious that the market is running out of steam.
Source: Tom McClellan
This week, we will learn quite a bit about where the market can go from here. On Wednesday, we have get CPI inflation data as well as the Federal Reserve decision and Jerome Powell’s press conference. Thursday will be important for inflation as well, with PPI data and preliminary readings on Consumer Sentiment. And to feed into the AI bubble buzz, on Monday Apple has its WWDC conference where it is expected to unveil details about its entry into generative AI offerings.
I feel pretty confident heading into this week in my belief that the market has topped in the current cycle, but like any wise financial market participant, I am 100% open to having my beliefs changed by the data. Let’s see what this week brings…
As is the norm here at Fast Break Finance, I’ll leave you with a JAM that defines our weekly topic - The Recession (Intro) by Young Jeezy.
Until next week…P & L ✌🏼
- Brian


